Understanding Uncertainty for Forest Carbon Measurement: Tree Size Variability
Uncertainty is a certainty: it’s vital we understand, present, and address it. The natural variability in tree measurements is one source of uncertainty that must be considered and accounted for when estimating carbon sequestered by trees.
Carbon Credits
Science & Tech
Project Development
Apr 23, 2024
Jesse Smith
Overview
Trustworthy measurement and reporting of carbon stocks are essential to functioning and high-integrity carbon markets. But uncertainty is inevitable: no methodology is completely accurate. So, how accurate are carbon estimates for nature-based projects? What are the sources of uncertainty? Finally, how is Treeconomy working to address uncertainty?
This is the first in our “Understanding Uncertainty” blog series from the scientific team behind Treeconomy’s industry-leading carbon measurement, monitoring, and reporting capability.
Today, we take a closer look at the inherent variability of trees and the relationships we use to measure them.
Estimates and distrust in nature-based projects
The nature-based voluntary carbon market has been criticised in recent years for erroneous carbon estimates and grossly exaggerated project benefits.
Investors, developers, and buyers require confidence in carbon estimates for nature-based projects, yet digital measurement, reporting, and verification (dMRV) providers rarely include uncertainties in estimates, undermining trust and transparency.
To be as transparent as possible, Treeconomy now endeavours to estimate the range of carbon stored in not only the overall project but also for each individual measured tree and the probabilities associated with our estimates. This means we can estimate that a biomass or carbon value will fall within a given range a certain percent of the time.
But is it even possible to know how accurate a prediction of carbon is in the first place?
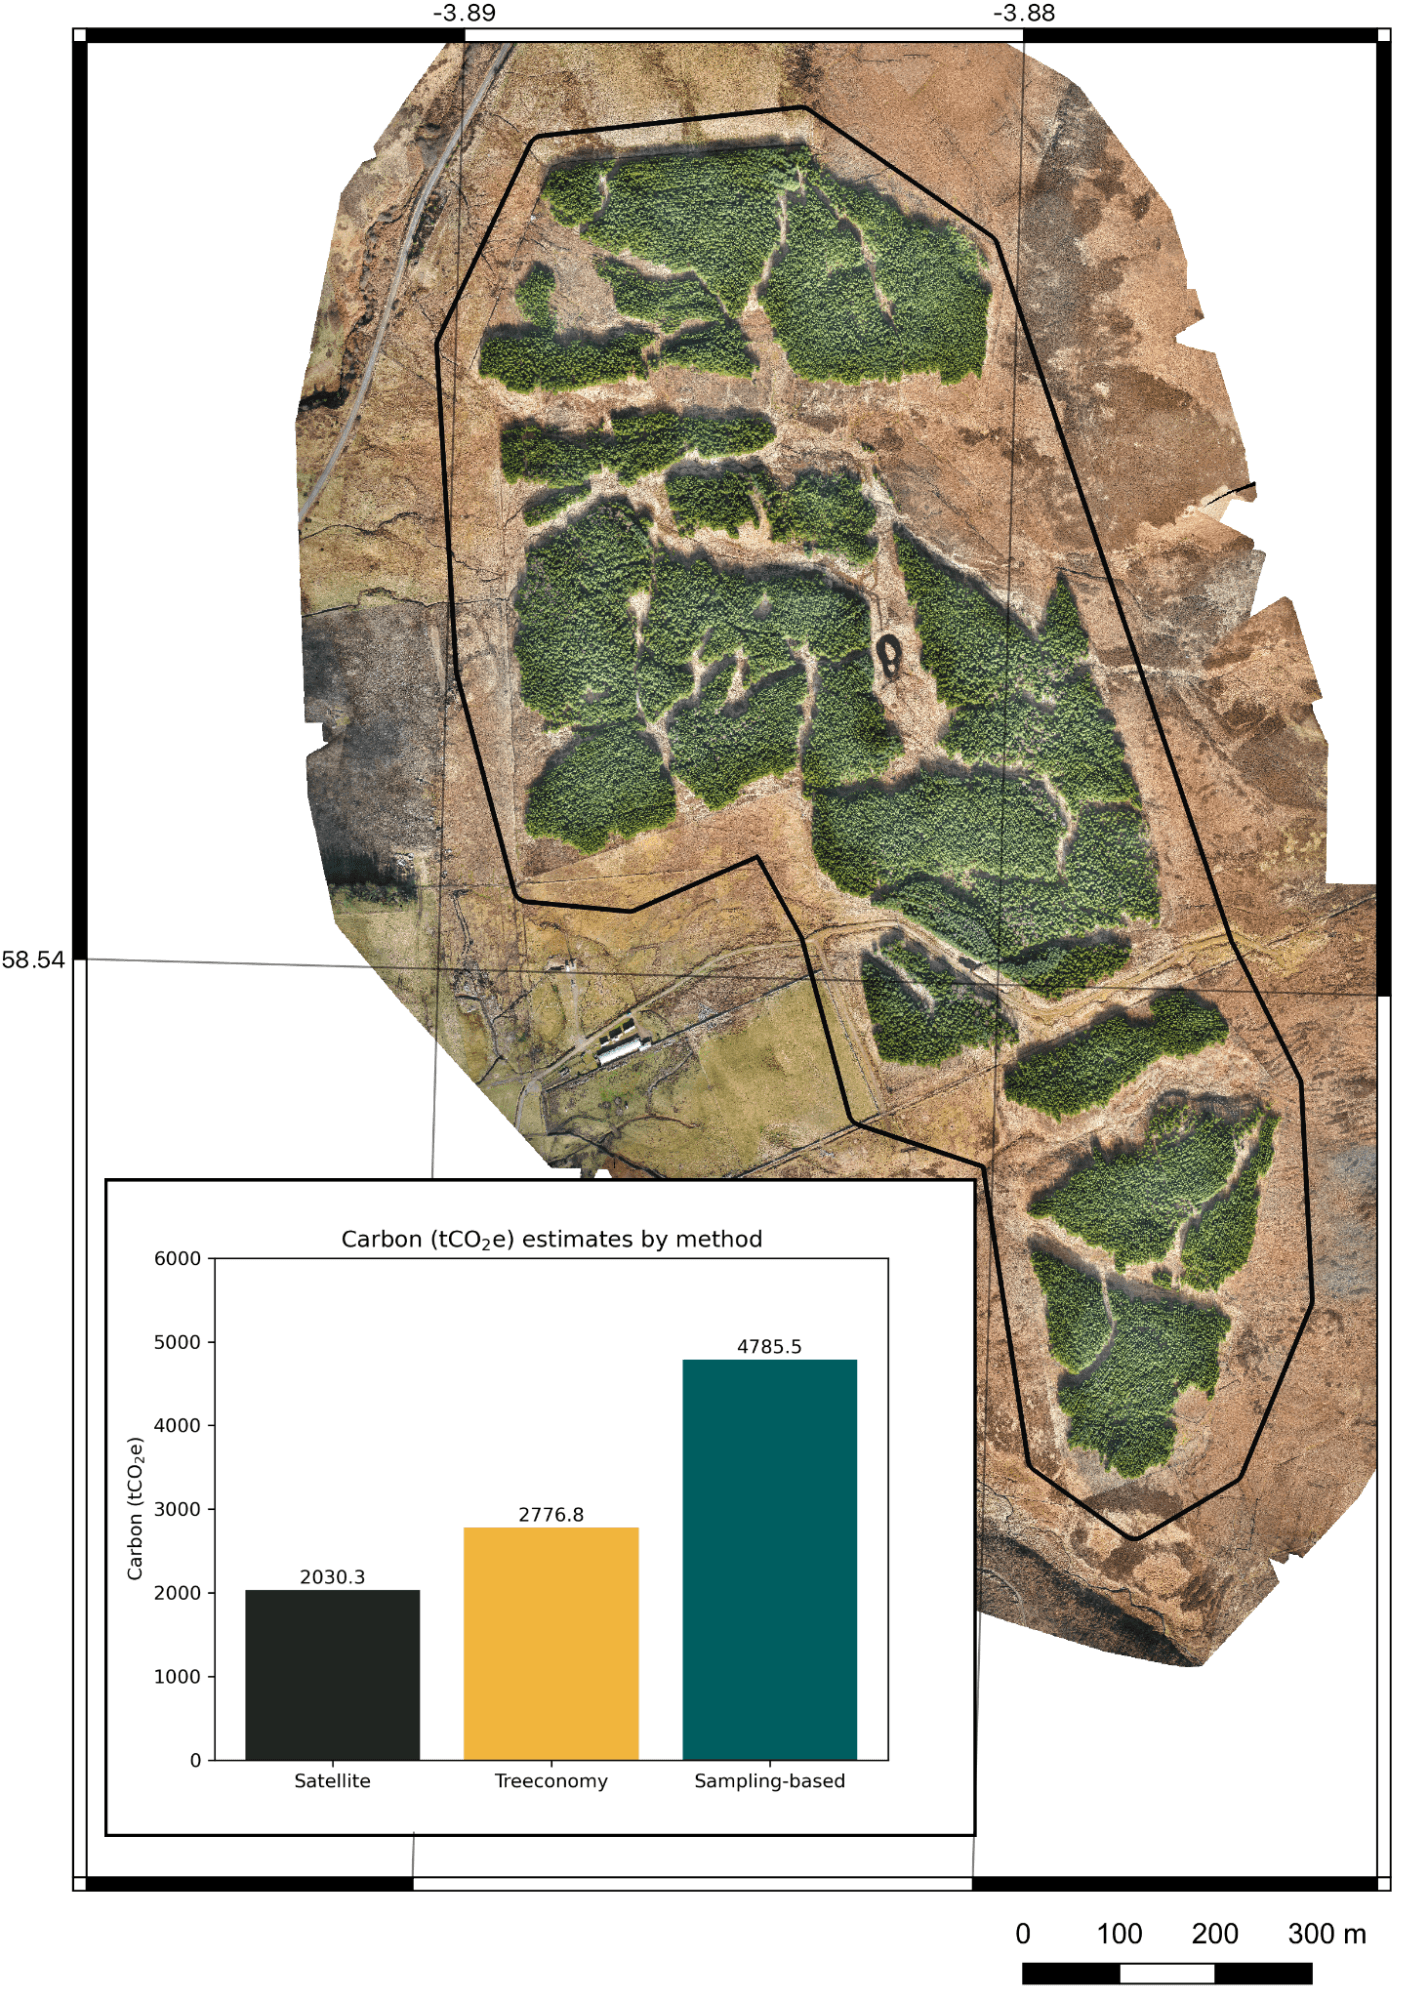
Map of a forest carbon project in Scotland, UK. The bar chart shows three different estimates of total project carbon in woody biomass in 2021, each from a different source and calculated via different methods.
Challenges in measuring tree biomass
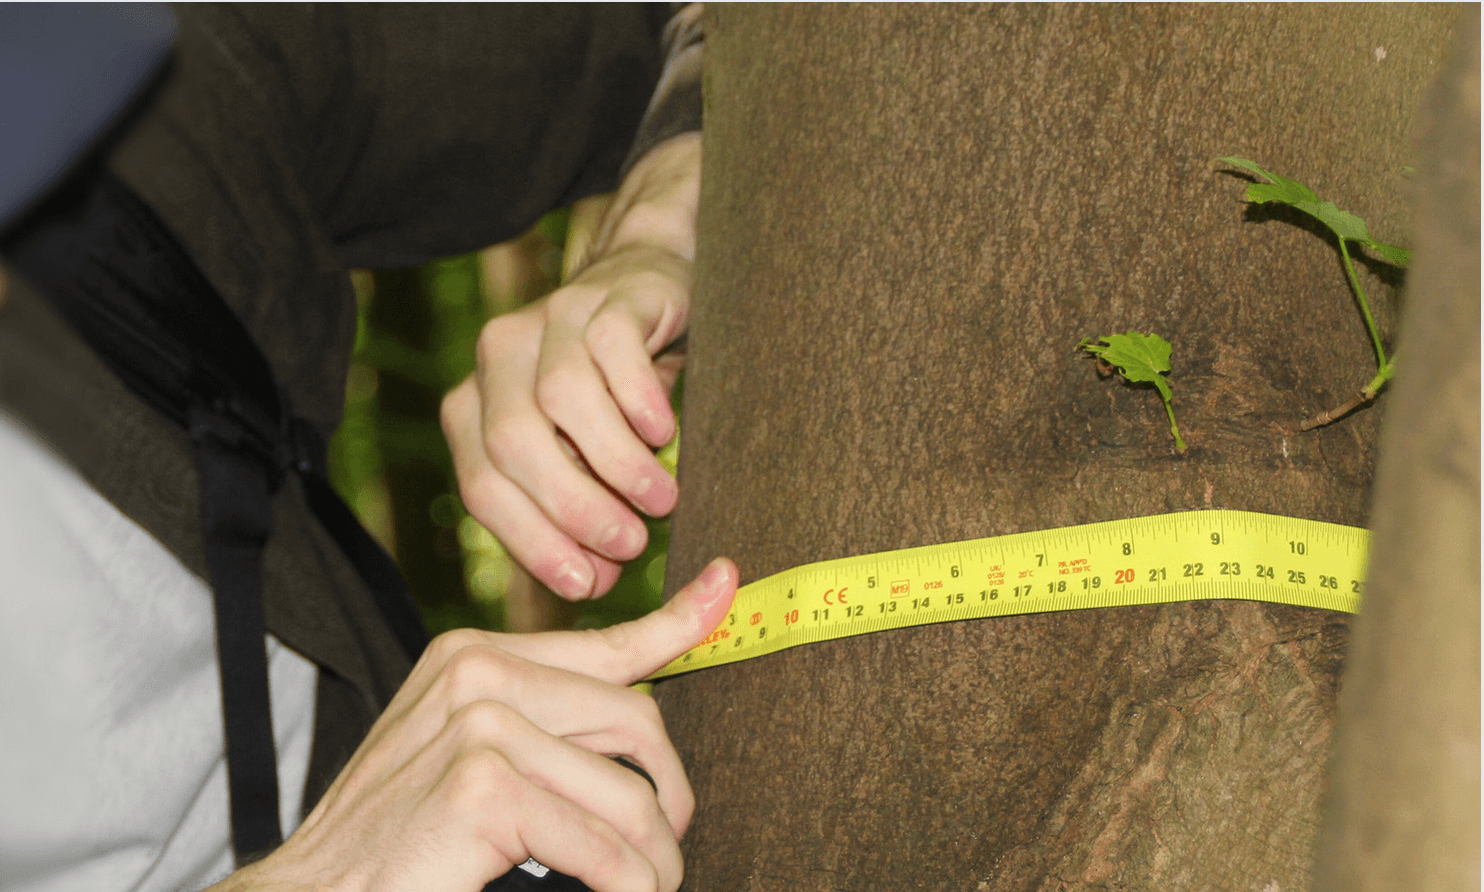
To directly measure tree biomass and the carbon stored within it requires felling or uprooting a living tree, then drying and weighing it with heavy machinery. This is referred to as “destructive sampling.” Obviously, this is not a realistic practice across an entire project: the process is slow, costly, and highly labour-intensive. Moreover, extensive felling is contrary to the goals of most reforestation projects.
Instead, tree weight (or biomass) is conventionally estimated by relating it to dimensions that are easier to measure, like height and trunk diameter. Foresters have been able to validate these relationships using trees they have chopped down and weighed themselves. The relationship between living things and their growth is a field of science of its own called allometry.
The role of allometry in carbon estimation
Allometry is not only useful for estimating the biomass of a tree, but also for predicting the other dimensions of the tree, like height or diameter. For example, for a spruce tree with a height of 10 metres, an allometric equation might predict the diameter of the same tree to be 15 cm, or vice-versa.
This is valuable to remote sensing-based efforts of carbon measurement. While aerial surveying can be employed to reliably measure tree height, direct measurement of tree diameter from the sky is not presently commercially viable for monitoring at scale. However, we can use allometry to estimate a tree’s diameter from its aerially measured height. If we know these two things, we have the ingredients we need to make an educated guess at the tree’s overall biomass and, therefore, the carbon stored within.
Check out our Ackron project case study series for more info on conventional carbon measurement techniques and the value of remote sensing technology.
Models and the inherent variability of trees
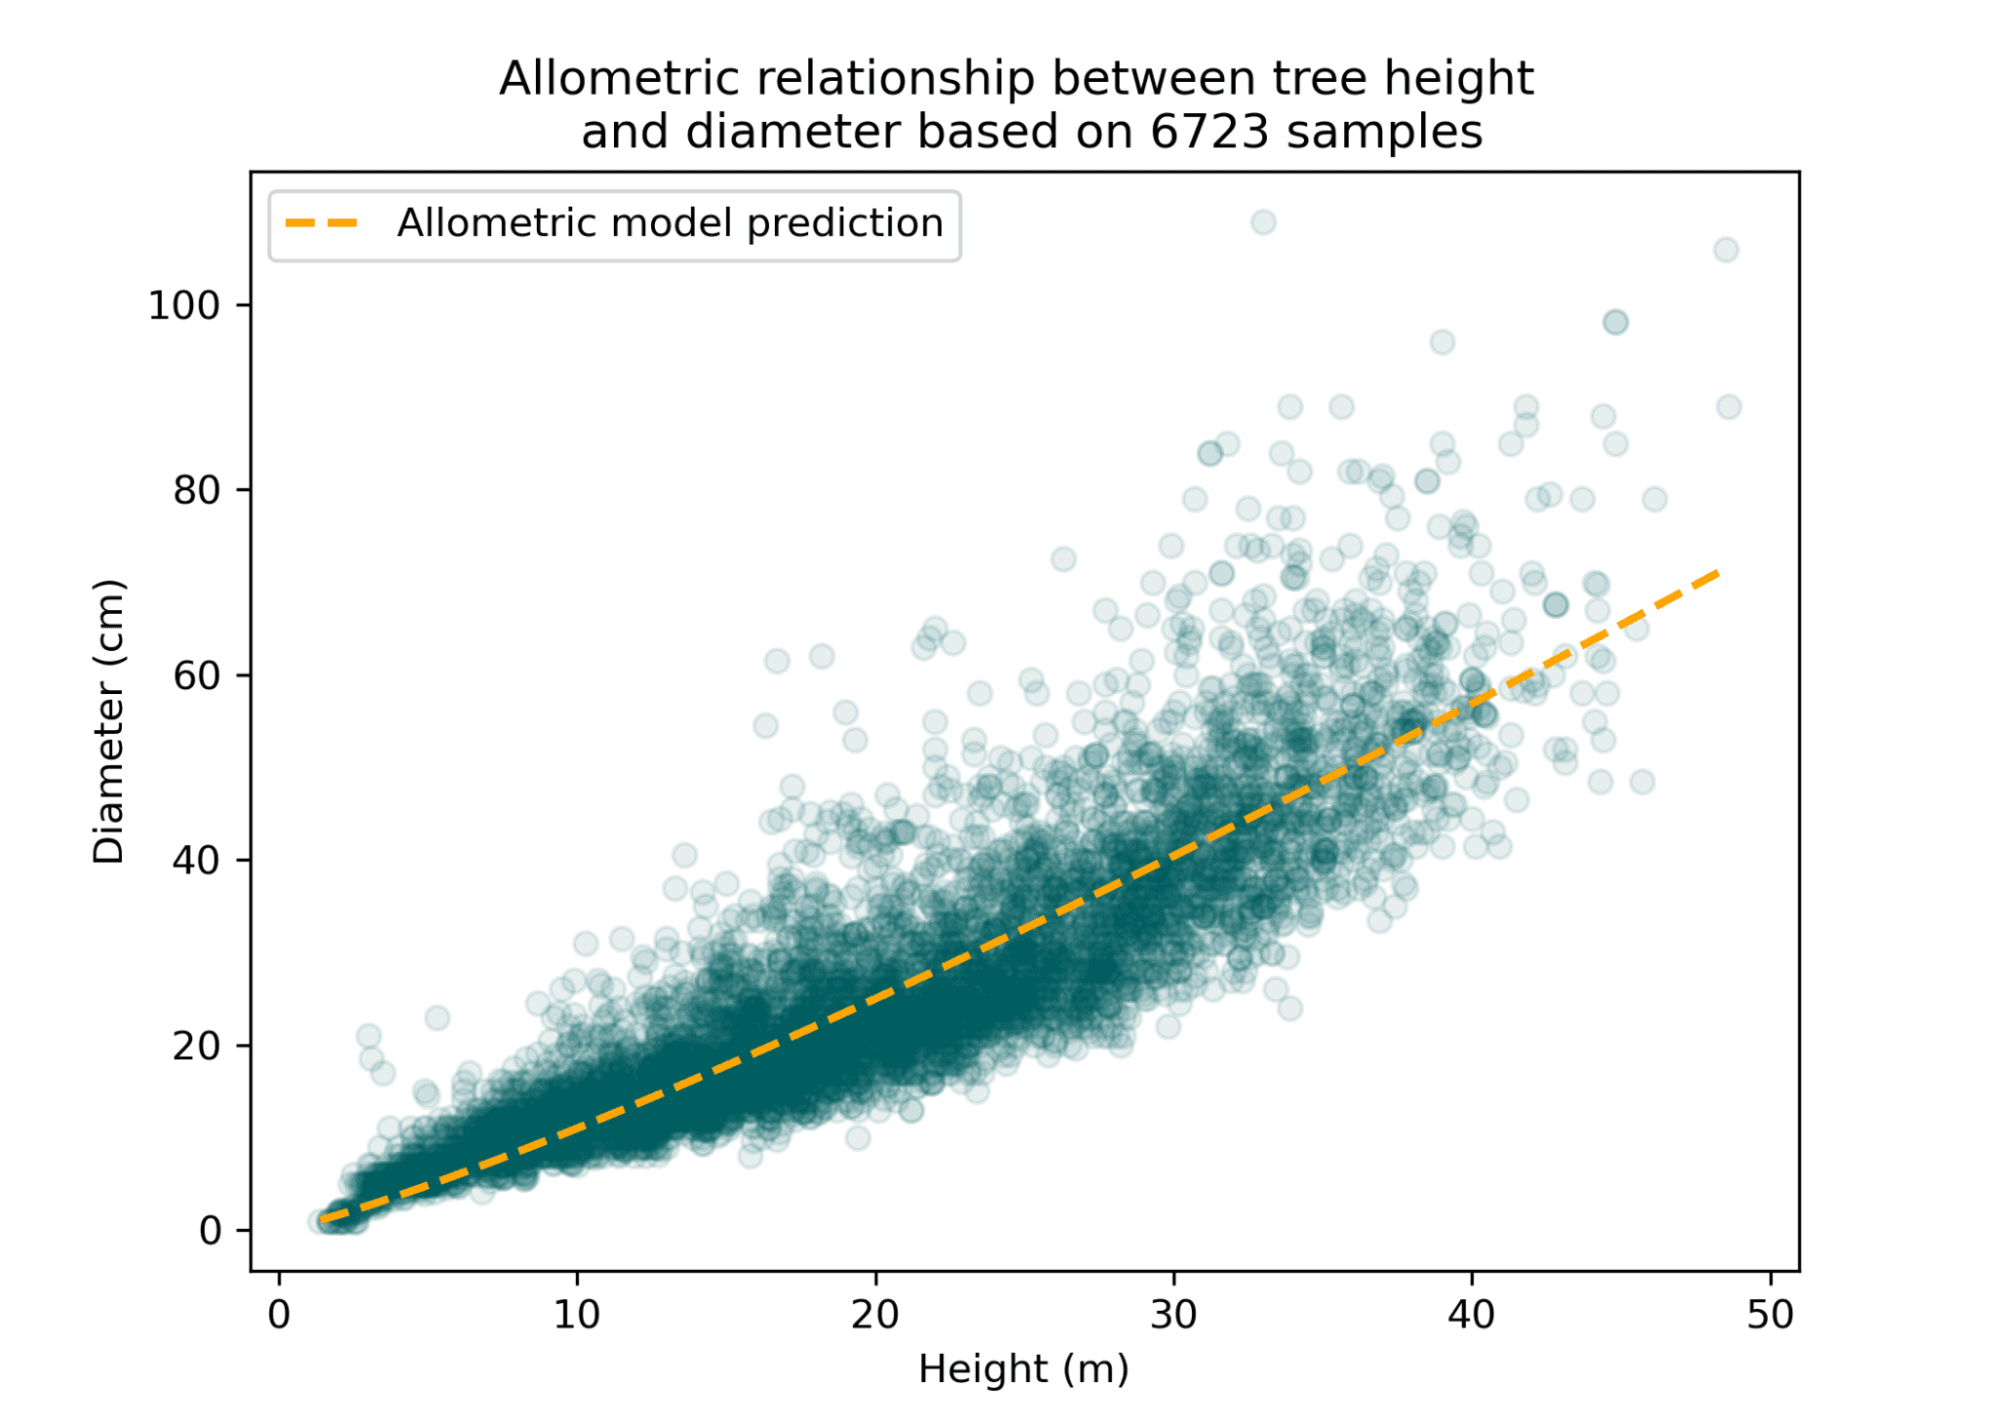
Height and diameter of over 6,000 Norway spruce trees. The allometric relationship is approximated with a model (yellow hatched line).
Note the overall relationship between height and diameter in the above plot, meaning that as height increases, a proportional increase in diameter occurs. We can therefore use this model to estimate diameter in scenarios when only the height for Norway spruce is known.
These models relate a height to a single diameter value, but two trees of the same height can have different diameters (and therefore different overall sizes), so what do we do about the possibility of the different carbon outcomes that can occur downstream? In reality, a tree of a given height will not always have the exact same diameter and is very likely to vary – possibly by a lot. An allometric equation might under or over-predict the diameter, leading to a much lower or higher mass and carbon stock estimate. It’s, therefore, important to account for those potential differences in our carbon measurement methodology.
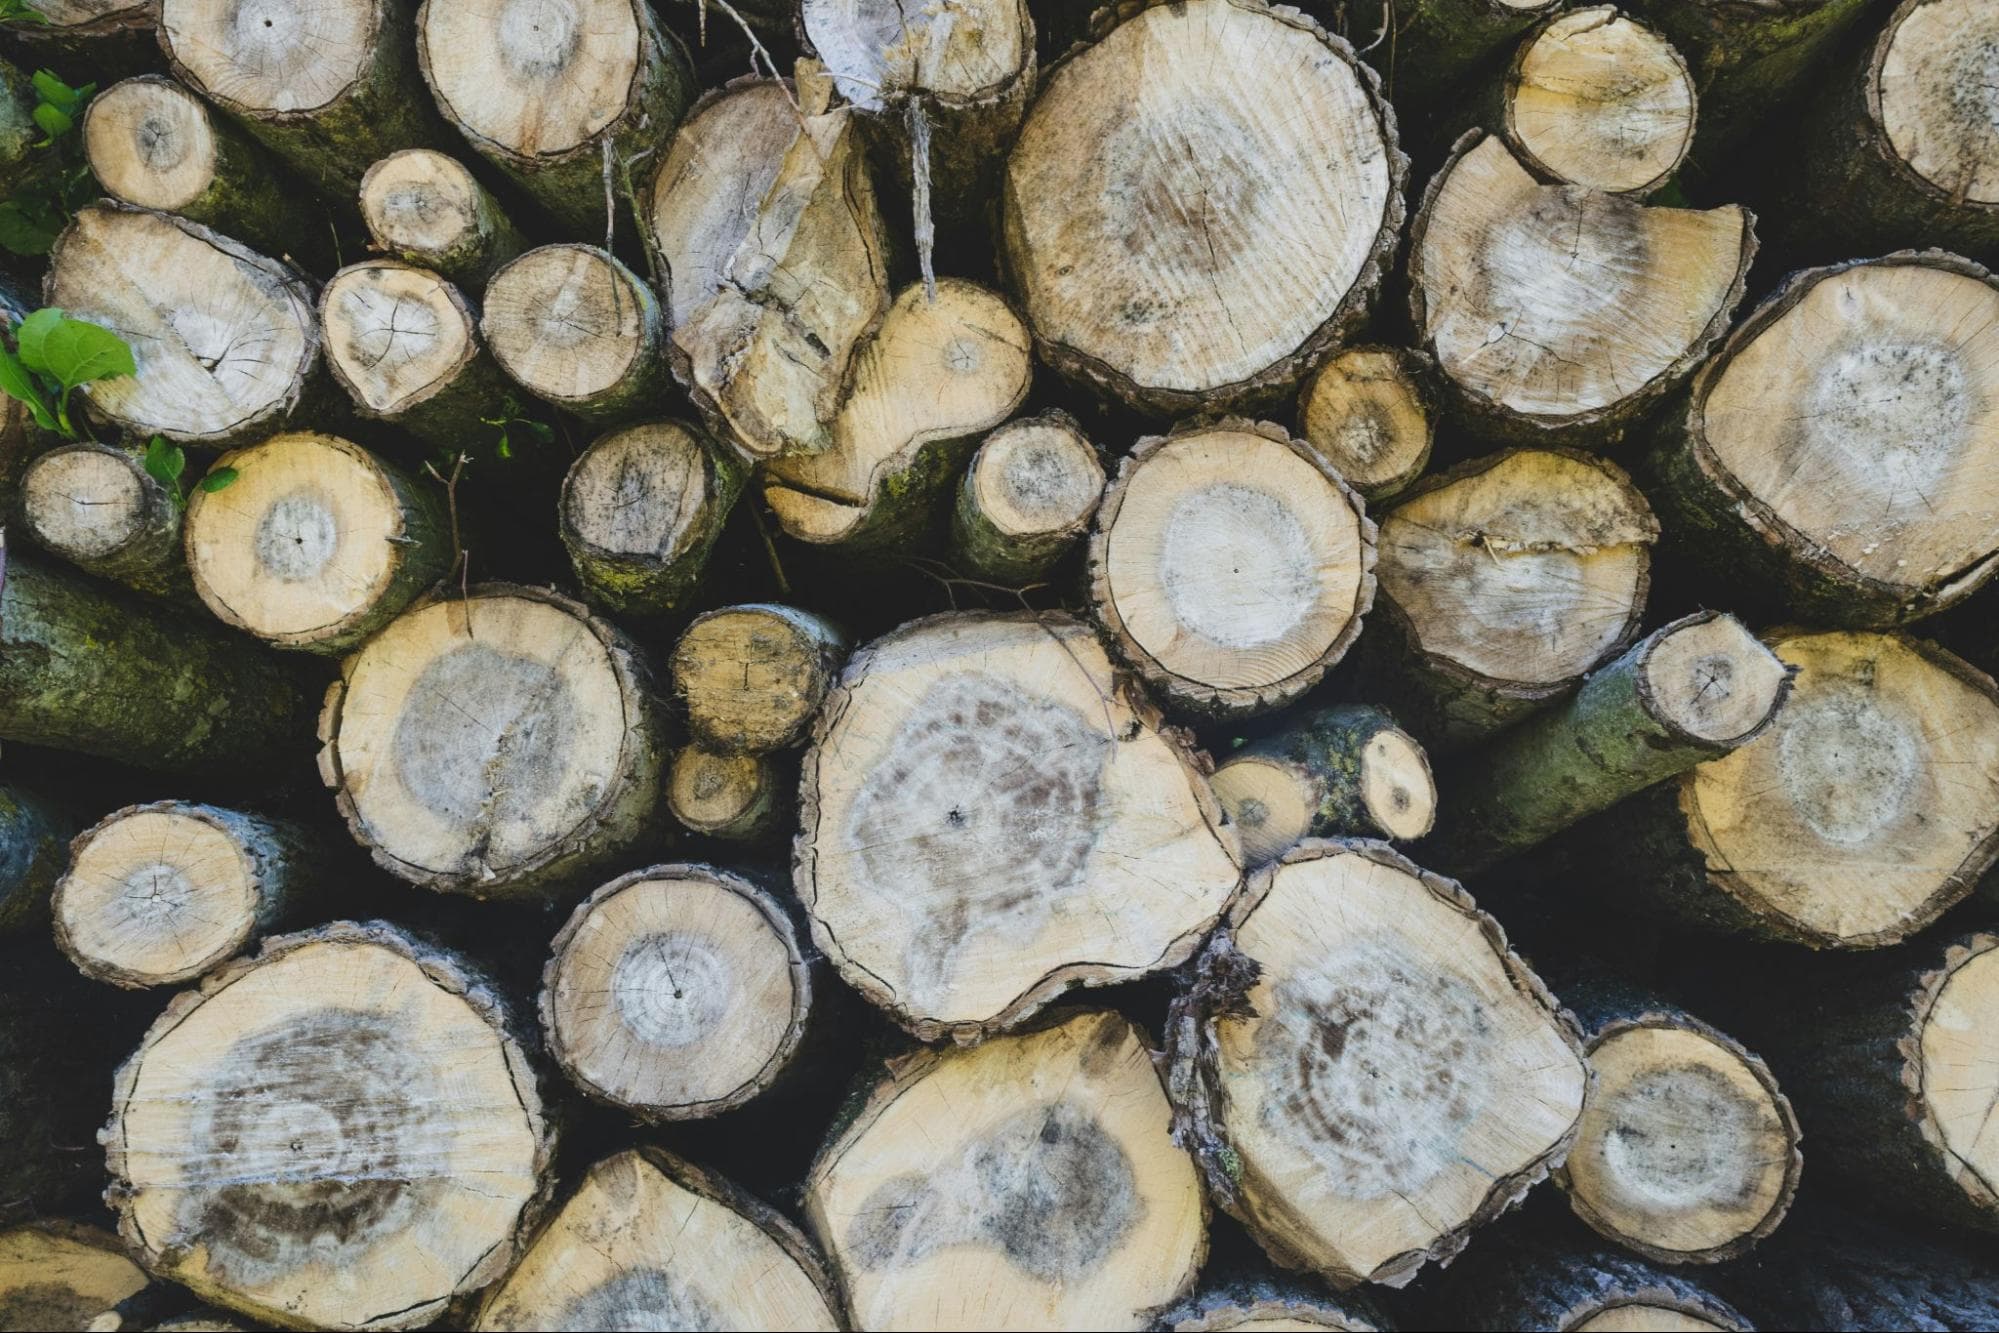
Consider a pile of logs. They may all be different in diameter, but approximately the same length. They will contain different amounts of carbon, and this should be accounted for when estimating biomass or carbon for standing trees.
In afforestation projects, the variability in diameter for a given tree height is meaningful because these variations can contribute to potentially significant carbon underestimation or overestimation.
Both are problematic: carbon underestimation means projects may under-issue credits and not be rewarded for the true and total value of their climate impact contributions. In the case of carbon overestimation, credit buyers are over-promised and may purchase a greater number of carbon units than have actually been realised by the project. Overestimation in particular can erode public and buyer trust and confidence in nature-based carbon removal schemes.
Presenting ranges
By providing ranges of estimates and their probabilities, customers and the public are given a robust and scientifically honest range of outcomes, which acknowledges natural variability and recognises that “uncertainty is a certainty”: no estimate is perfect. Presenting honest uncertainty, rather than false certainty, can actually inspire confidence and support carbon market stakeholders in making more thoughtful, risk-aware decisions. Importantly, presenting uncertainty can help to safeguard against criticisms of inaccuracy and greenwashing on the part of carbon buyers.
These ranges can be thought of as a buffer around each carbon prediction, where, along with our best guess prediction, we also provide an estimate for what limits are possible as a result of allometric variability. For example, we can provide an absolute minimum/maximum observed diameter for a given tree height from our measurement databases. However, we can also provide a lower and upper limit based on the percentage of diameter measurements at a distance from the average diameter. The latter measurement is more useful since it’s more descriptive of “typical” trees for a given height and species.
In doing so, we can offer a central estimate as well as a worst- and best-case scenario. The stronger our predictions, the narrower the gap between all those numbers will be: understanding uncertainty and then working to reduce it is a major driver of our research as we strive to provide confidence to carbon developers, buyers, and investors.
Exploring uncertainty quantitatively
Consider the graph below. For a tree of 15m in height, notice how the possible diameters tend to “pile up” around the middle of the graph, corresponding to a diameter of about 19 cm. Our actual diameter prediction will fall somewhere here, but we will also provide measurements consistent with the edges of this range.
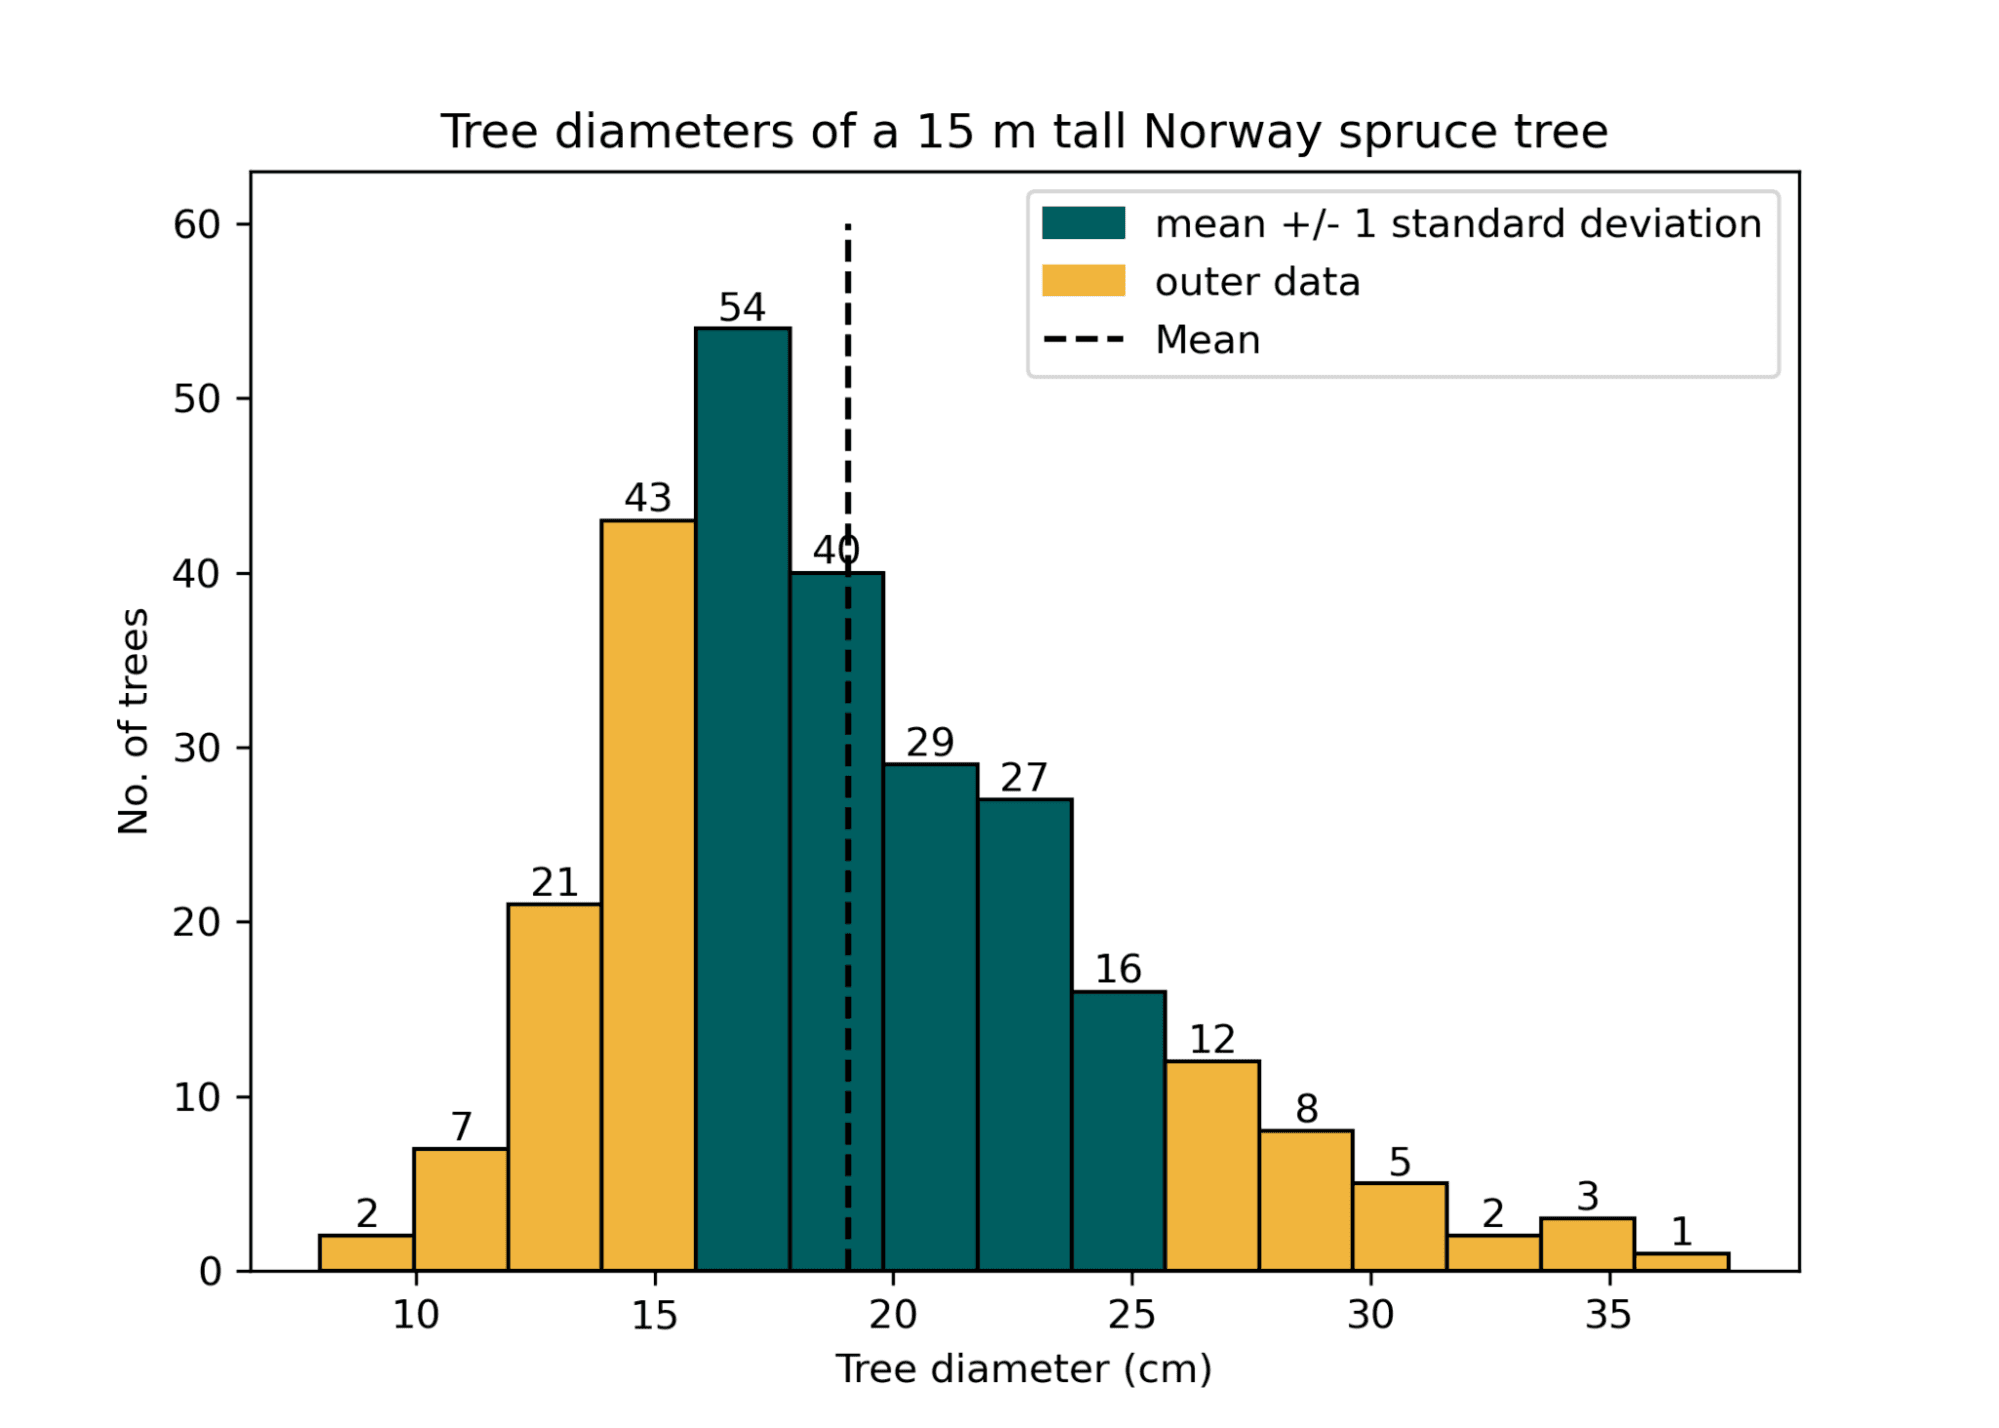
This is a histogram of stem diameters for a tree of 15m height. Most trees tend to occupy the 17 - 22 cm range where the average is (dotted line). The green bars represent the data within one standard deviation from the mean or about 68% of all the trees in this height range. In other words, 68% of 15 m high trees have a diameter between 16 and 25 cm. The gold bars show the outlier (less likely) diameter possibilities. Showing data one, two, or three standard deviations from the mean is common in statistical analysis.
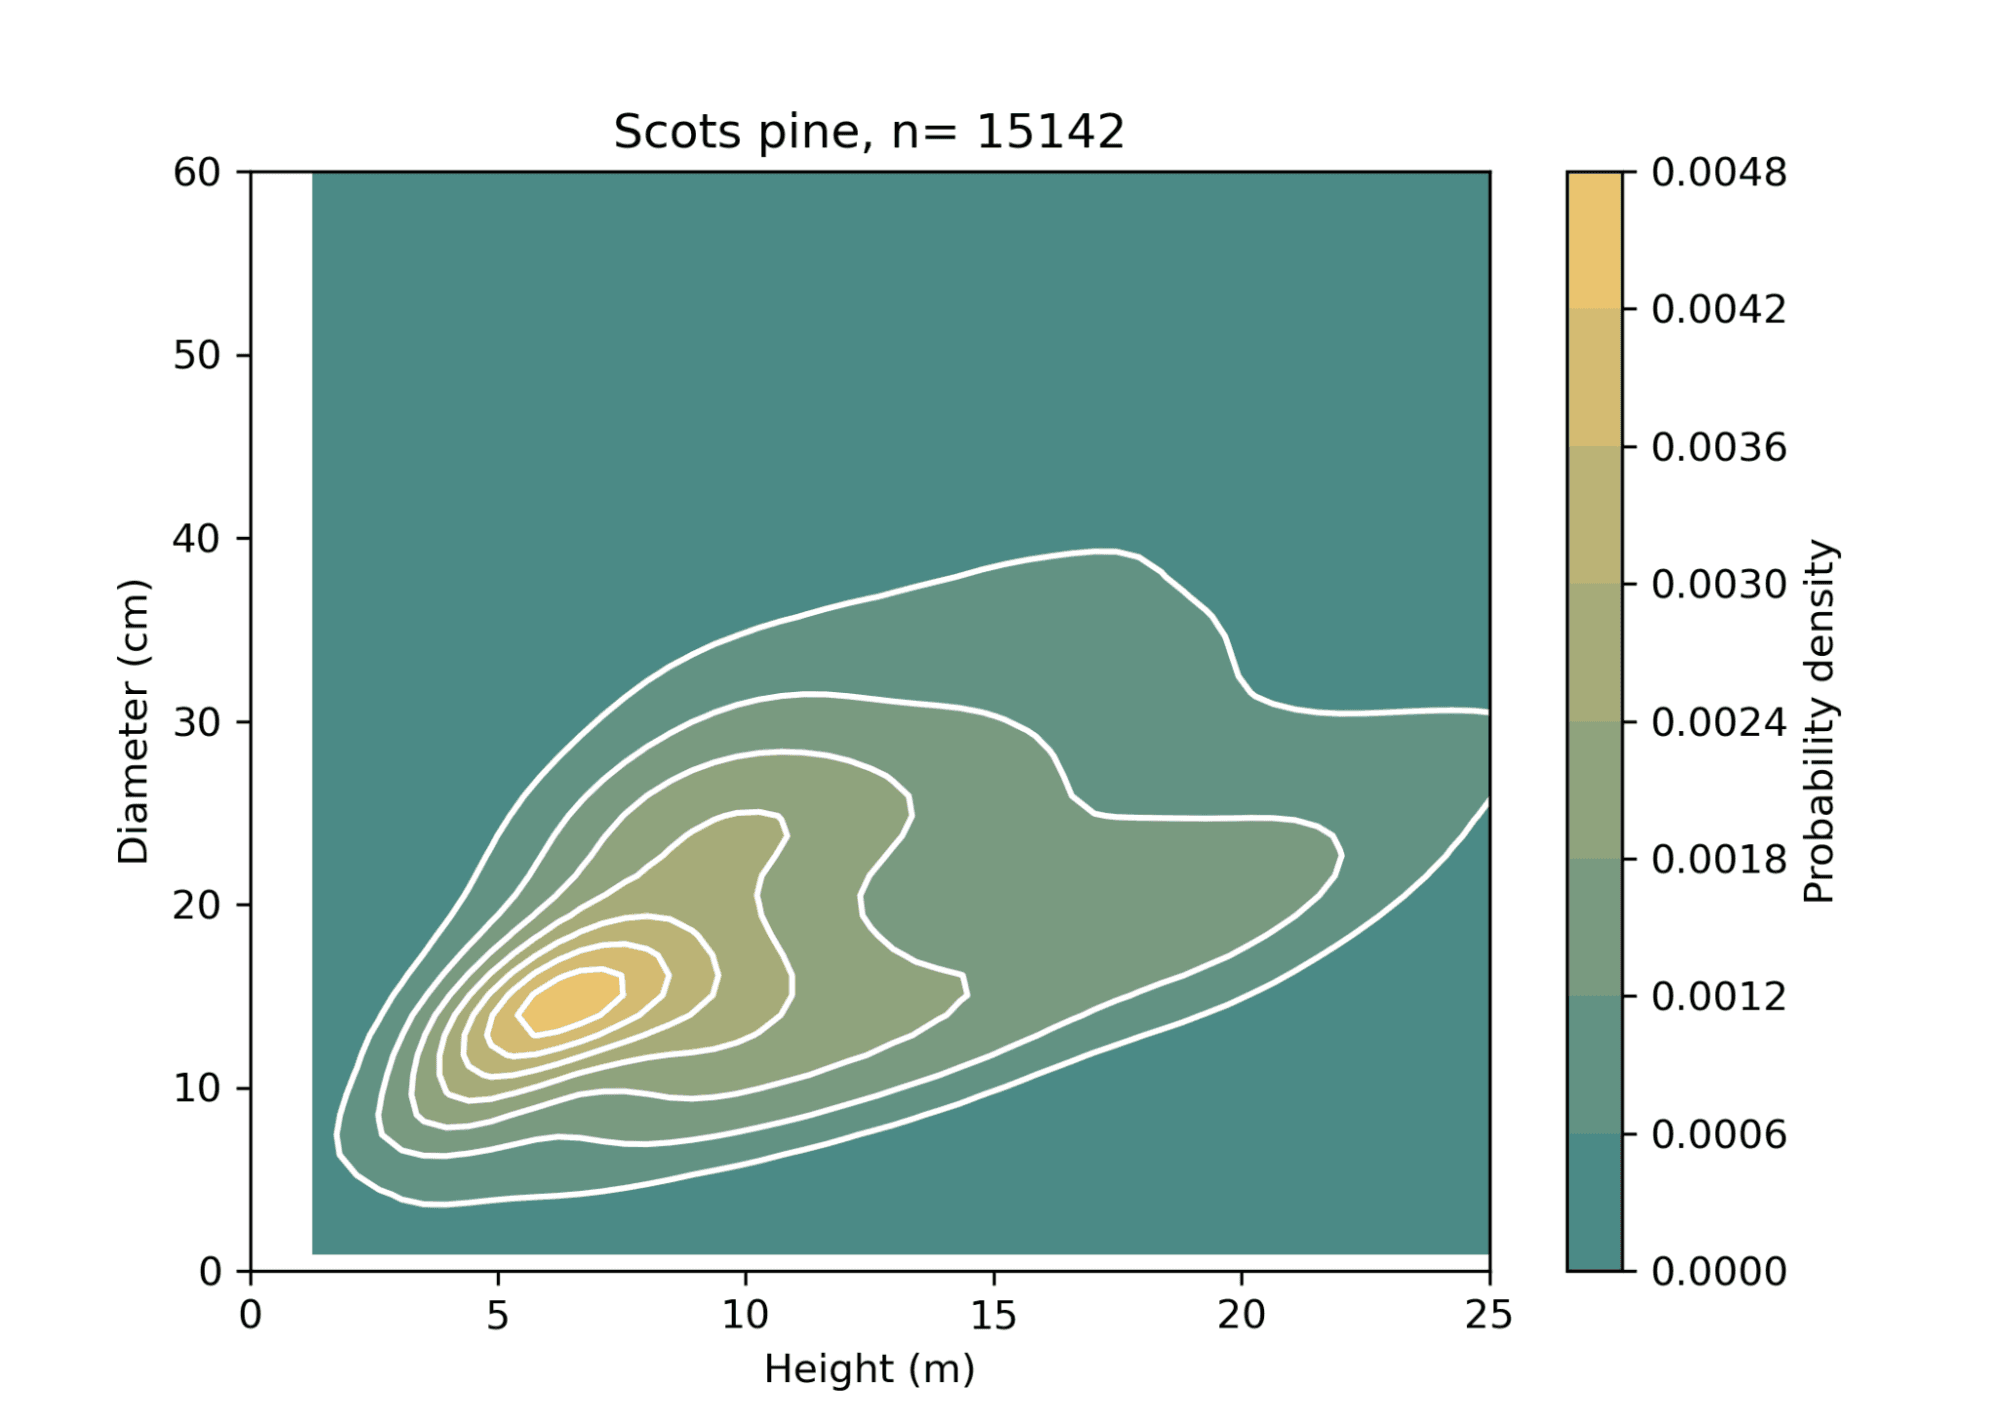
Another way of visualising this effect. This density graph shows Scots pine trees' most likely Height and Diameter combinations based on over 13,000 measured samples. The region with the brightest yellow corresponds to the most common height-diameter combinations. For example, there is a high relative likelihood that a 7m high Scots pine tree will have a diameter of about 15 cm. Conversely, it is virtually impossible for a 7 m high tree to have a diameter of 40 cm. This would be considered highly unlikely in nature.
Given the variation demonstrated in just a single tree, project carbon totals for forests comprising tens to hundreds of thousands of trees can be materially affected by the sum of this variation. We account for this across the entire project by calculating the total project carbon in all trees and then repeating this exercise many times using different plausible diameter combinations based on the height of each tree in the project. We can then take the total carbon from each of these “runs” and graph them out to see the range of total project carbon. From here, we can provide full-project ranges similar to those we present for individual trees, but now we have the whole picture and the effect on total carbon estimates.
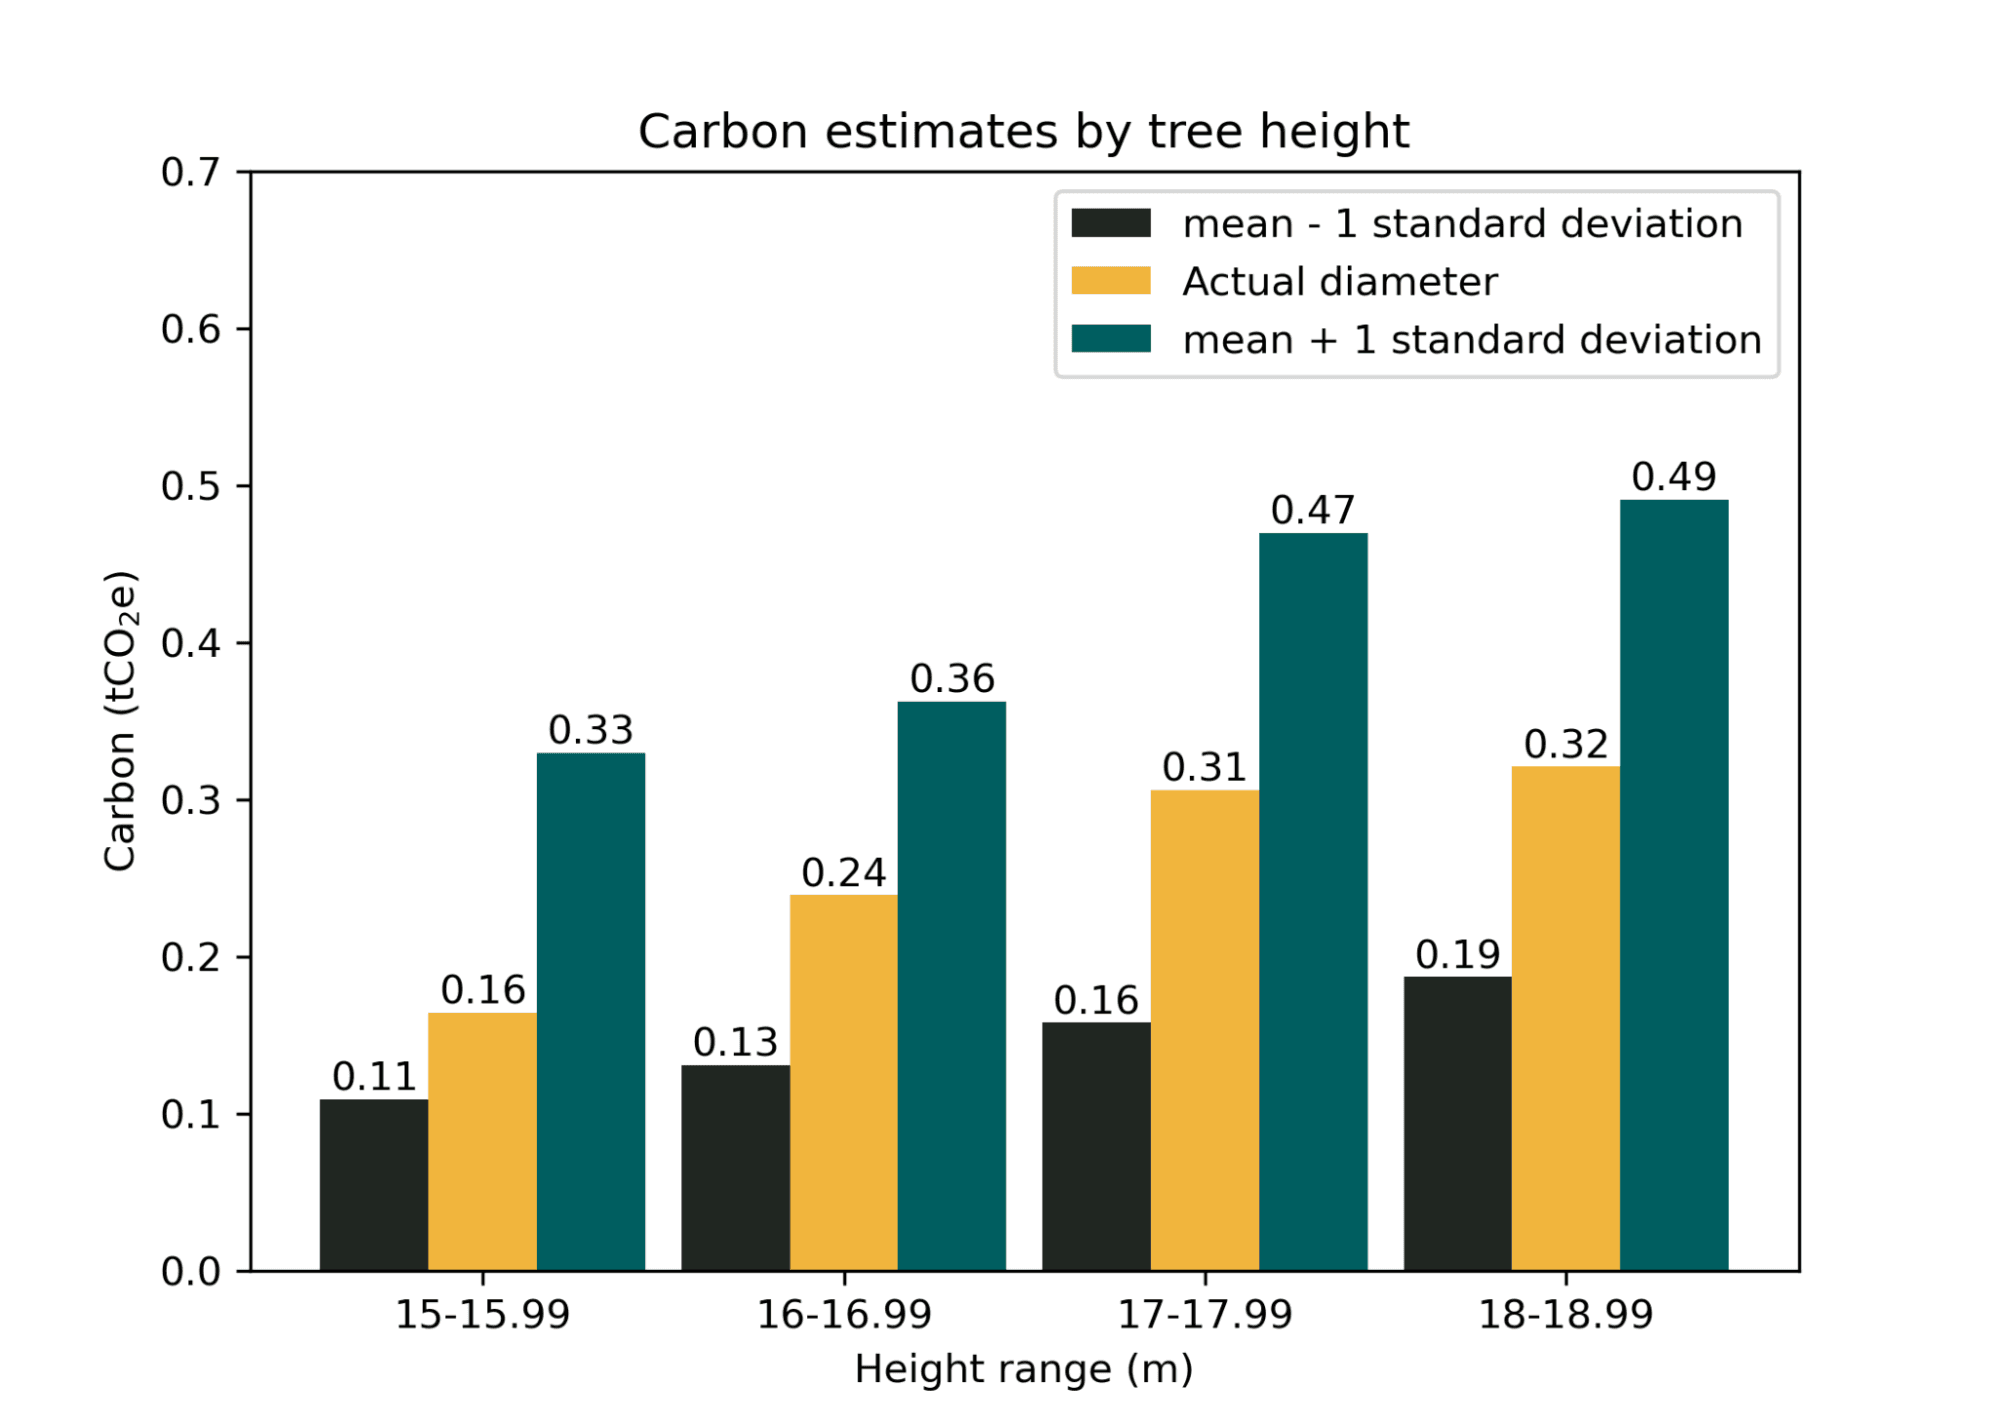
Here are four trees and the height ranges they each fall into (x-axis). Each of the clusters of bars represents how much carbon is stored in the tree, depending on whether the actual diameter value was used, the value located one standard deviation below the mean, or one standard deviation above the mean. The true value tends to fall between these two extremes but can occasionally exceed or underperform the ranges.
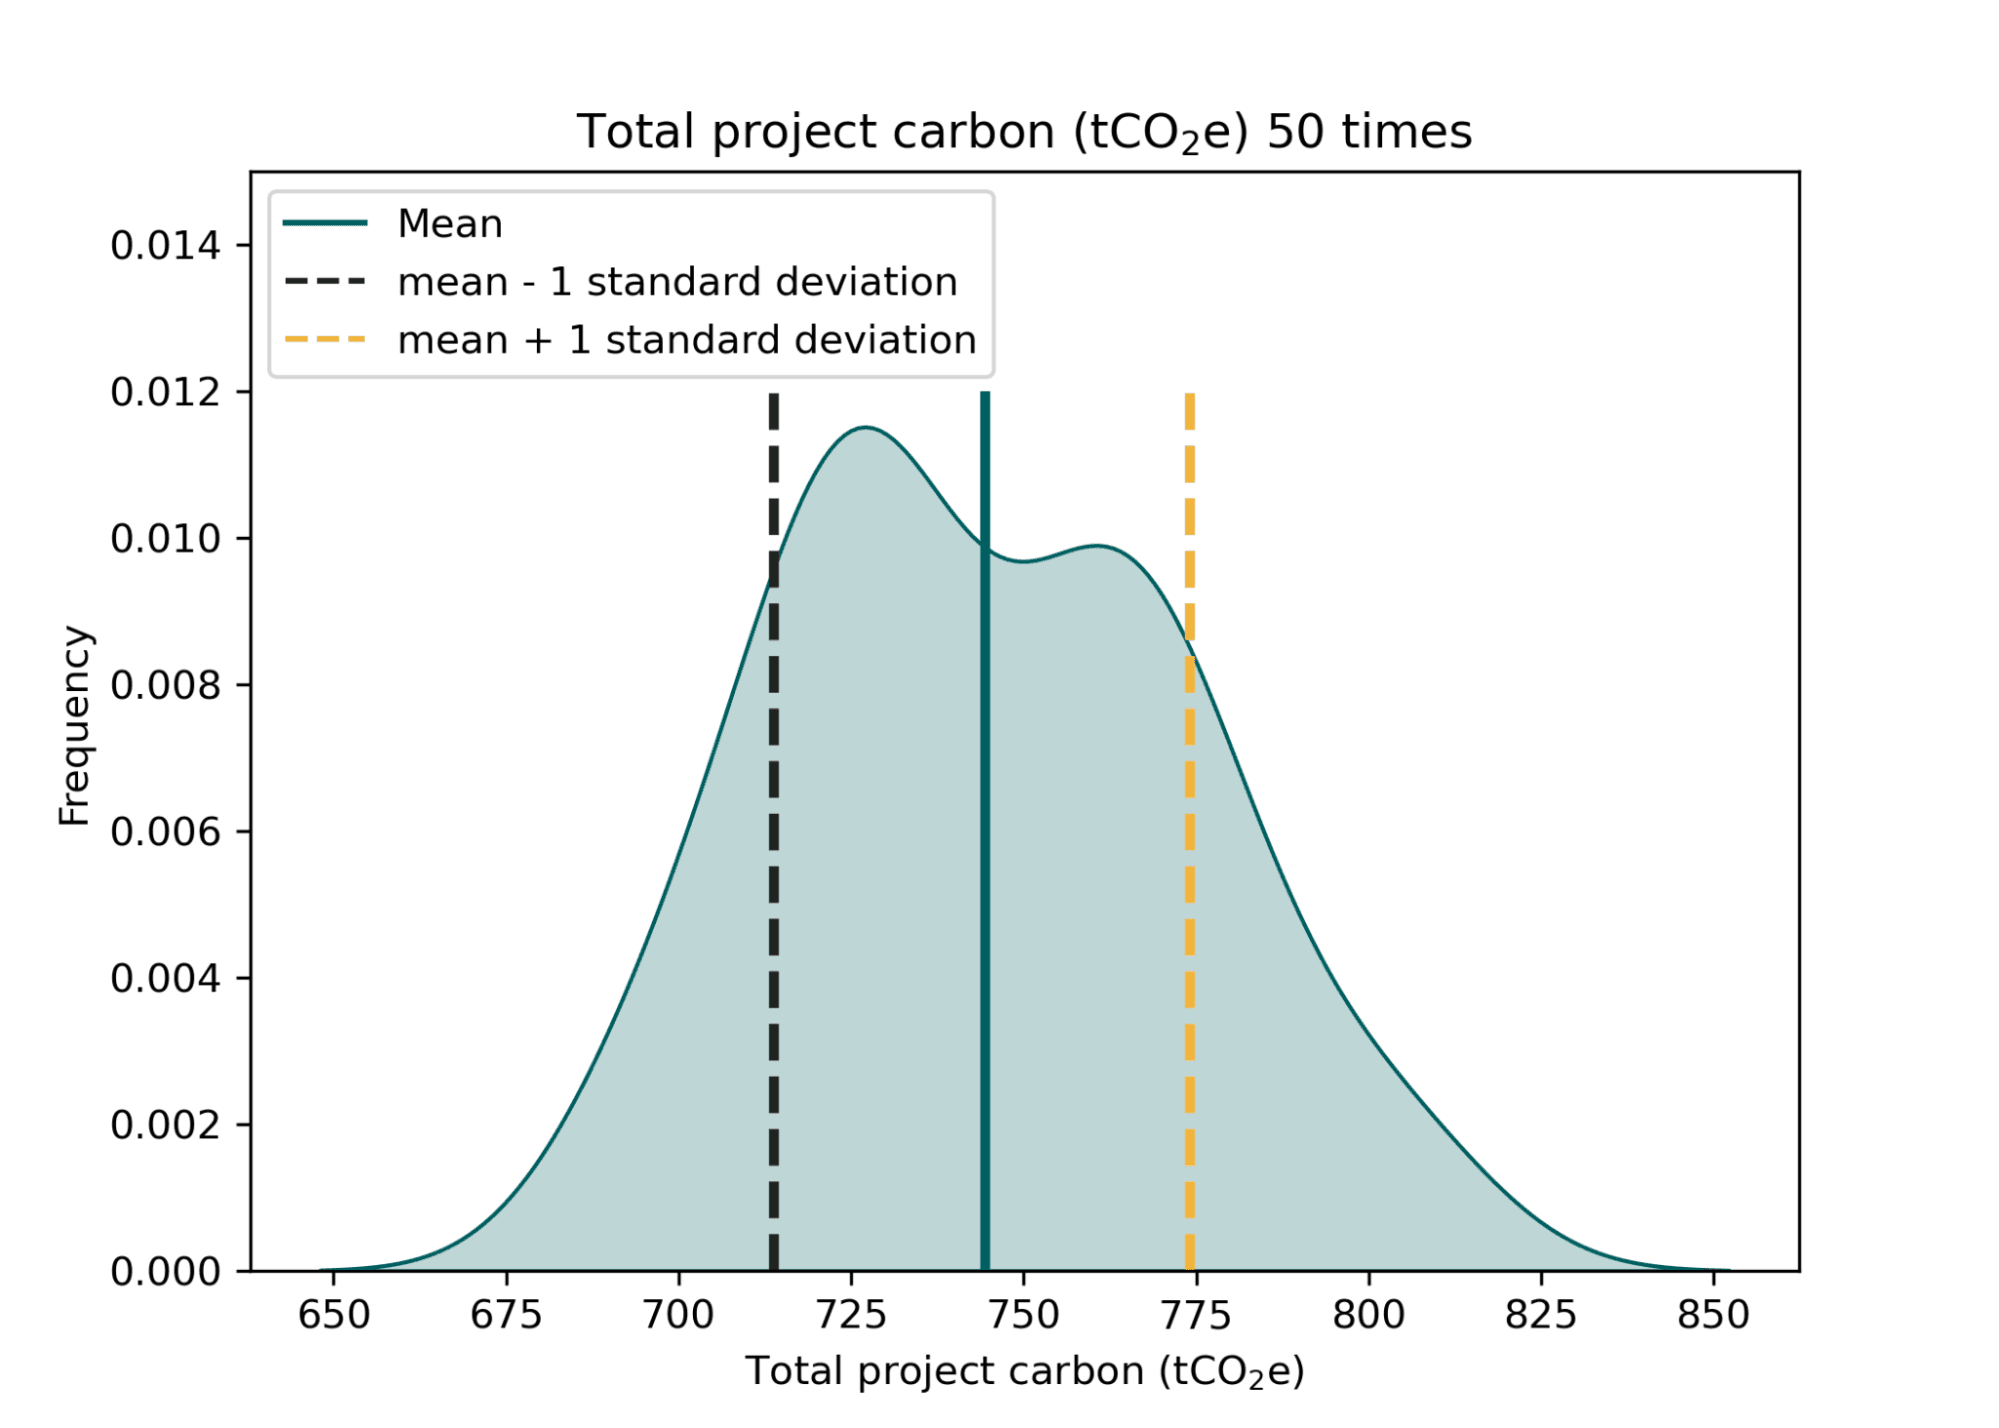
This plot shows 50 projects consisting of 1000 Norway spruce trees each. Each project has a different distribution of tree diameters. The total project carbon was calculated for each forest and plotted on this graph, so the number on the x-axis represents the total carbon of all trees in one forest. You can see that most of these forests are concentrated around 744 tCO2e of carbon storage, but there are extreme ranges from about 650 to 850 tCO2e.
We can, therefore, conclude that for a theoretical monoculture project site consisting of 1000 Norway spruce trees, we expect the amount of carbon storage to be about 742 tCO2e (the average). This number can theoretically be as low as 682 tCO2e and as high as 794 tCO2e. However, since those extreme values are so unlikely, they’re not particularly helpful, and we can further constrain this range and say 68% of the time, the minimum and maximum possible carbon values will fall between 708 and 774 tCO2e.
Delivering results in this manner is far more honest and insightful than offering a single predicted value. It provides different outcomes for different scenarios, and considers the possibility of site-specific variables that can influence results much better than a single estimation can. Also, we can see the variation is not very extreme, with the minimum and maximum outcomes being within 10% of the average prediction.
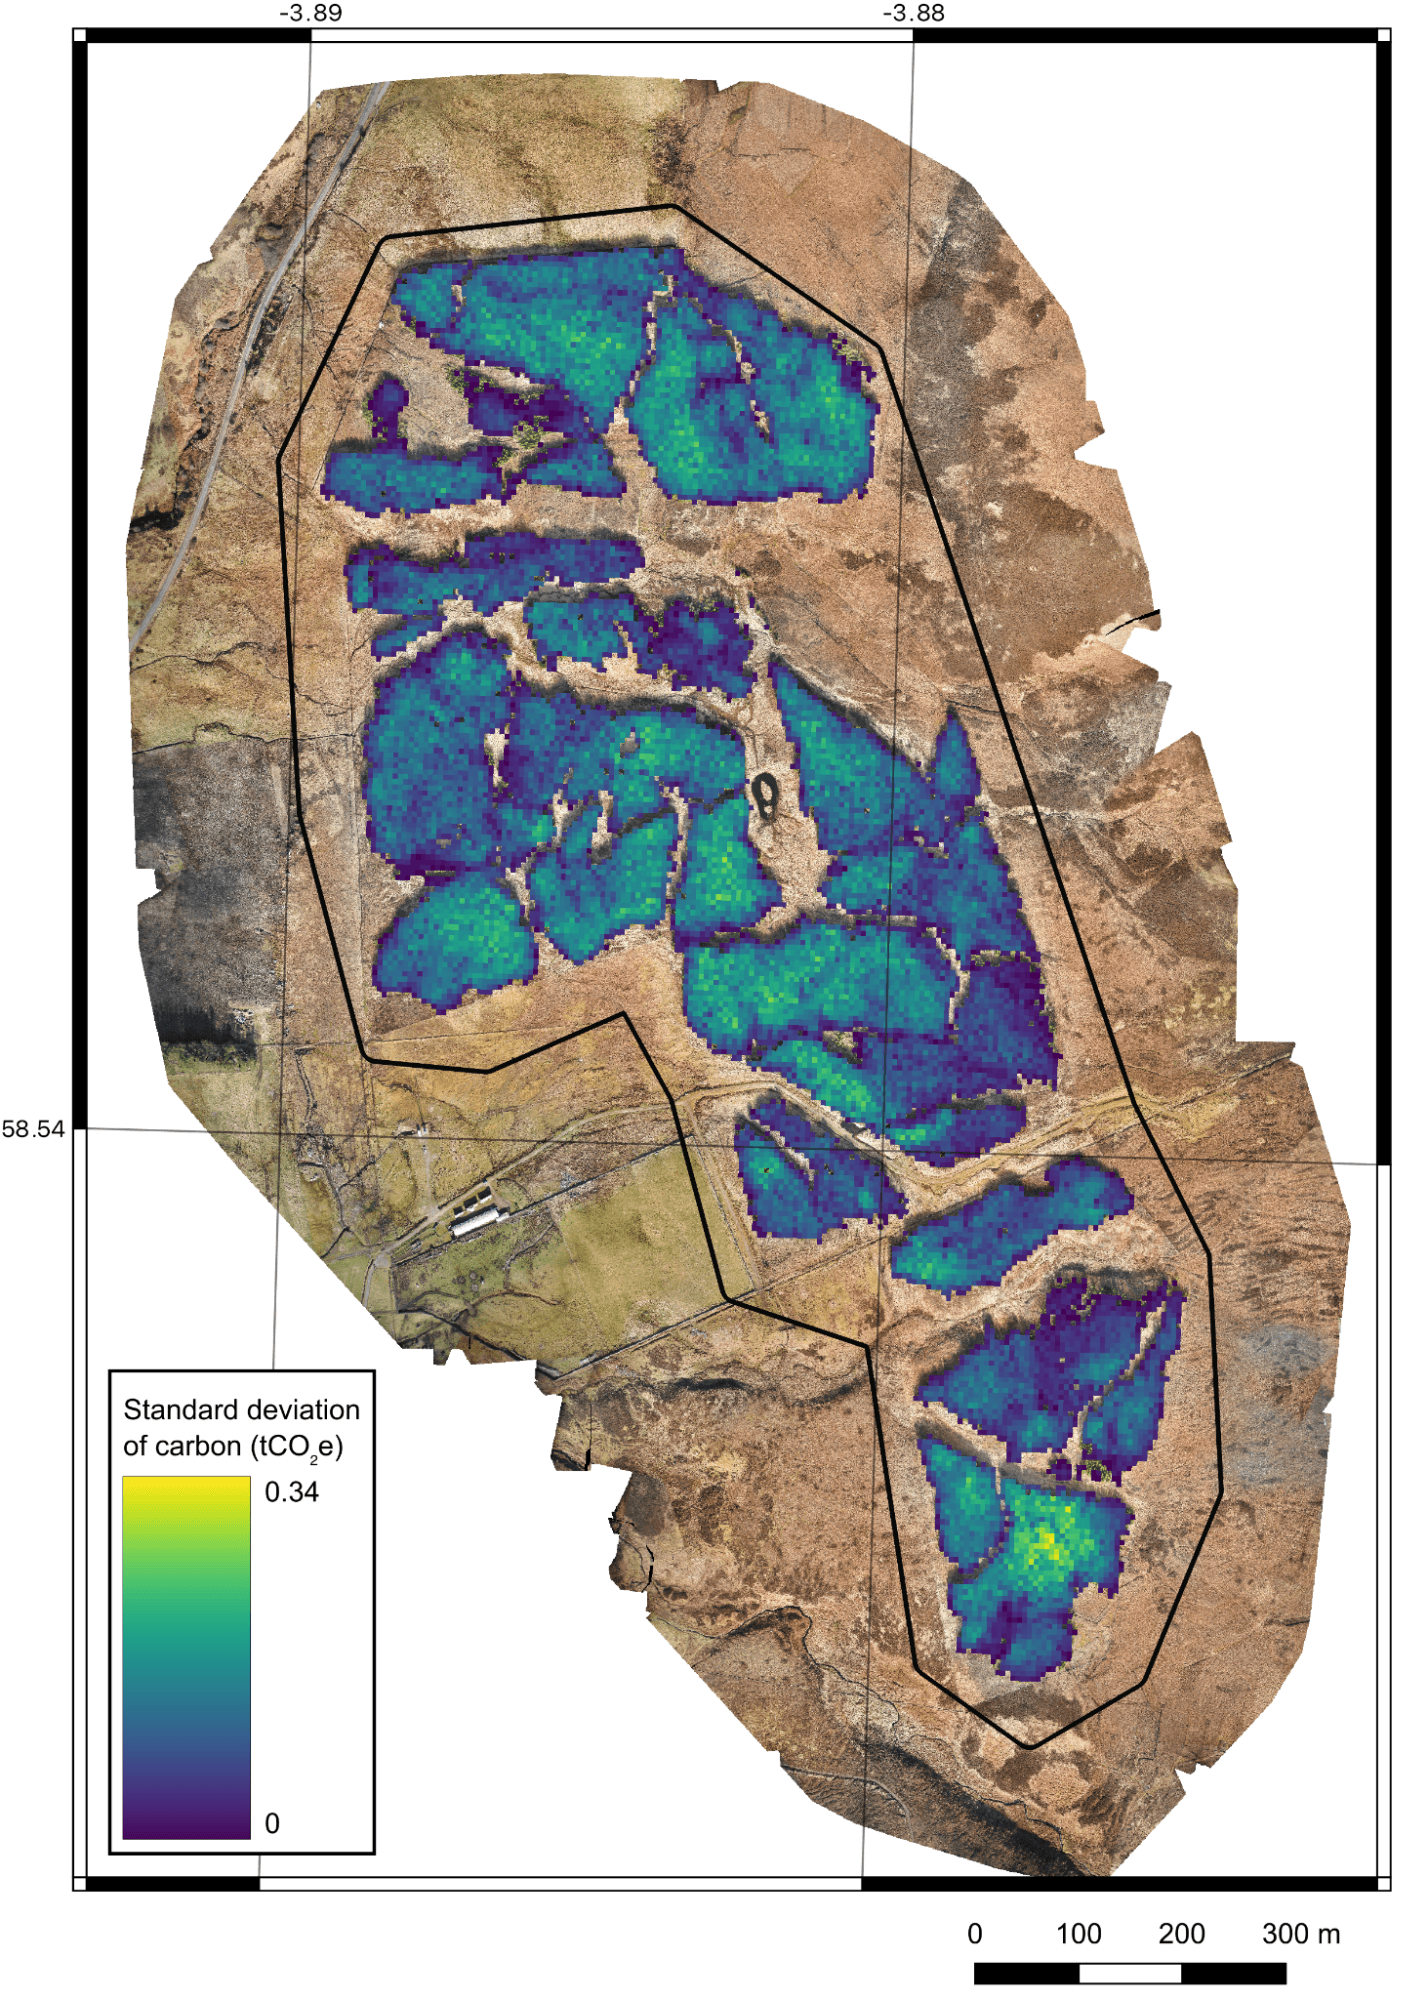
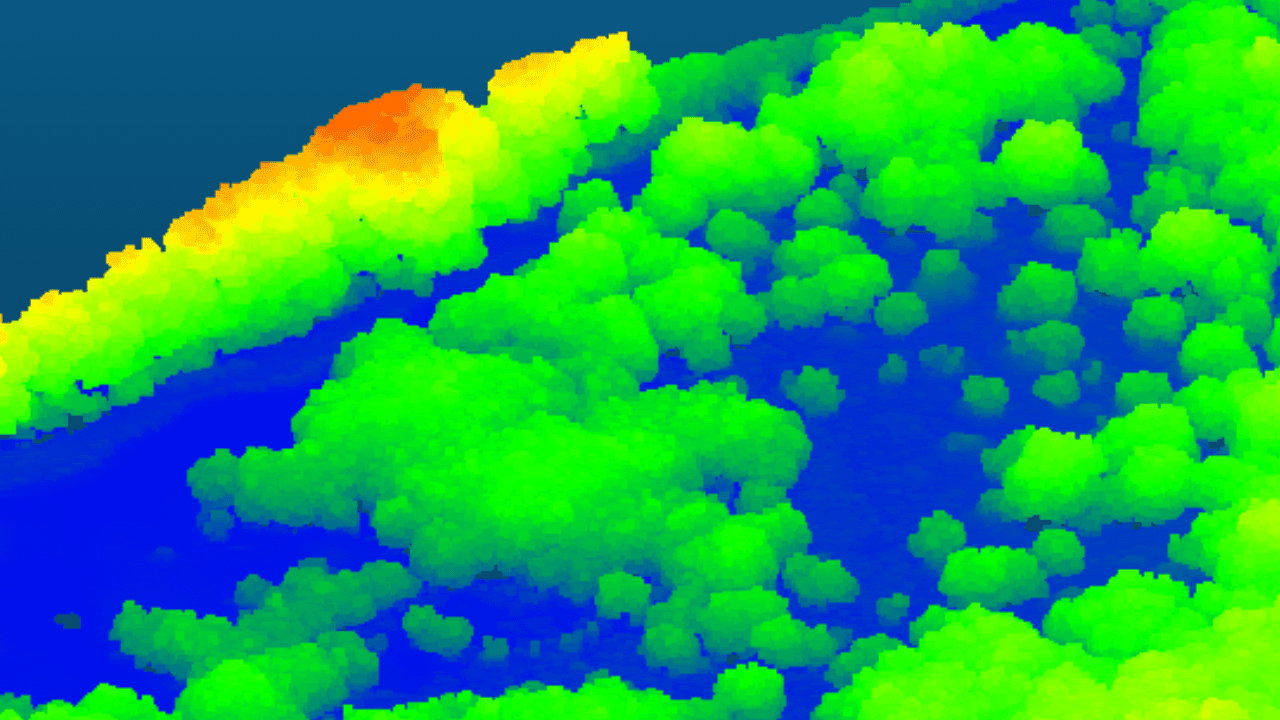
Finally, this map shows the standard deviation of our carbon calculations at a Scottish carbon project The lower (blue) values indicate locations with a higher certainty (or confidence level) in our carbon estimations, whereas the higher (yellow) values indicate a lower level of certainty. While this heat map shows where carbon variation is at its highest and lowest throughout the project overall, we can provide similar estimates for individual trees too.
How can we help?
Treeconomy offers best-in-class natural capital baselining and carbon measurement services with a multi-award-winning scientific team and our Sherwood nature-based project monitoring platform.
Our dedicated commercial team works to facilitate confident investment into a growing portfolio of fully-monitored nature projects on our marketplace.
We are trusted by landowners, natural capital investors, government agencies, carbon standards, and corporate carbon buyers.
Want to see how Treeconomy’s services can work for you?
Get in touch today for a free demo or consultation.